Blood Pressure Tracker with Chart | Printable Visual Log | Monitor Trends & Patterns
Visual blood pressure tracker with built-in charts. Plot your systolic, diastolic, and pulse readings directly on graph grids. Free printable with trend analysis features—see patterns instantly.
Numbers tell a story. But when you can see that story unfold on a chart, patterns become obvious and insights emerge. A visual blood pressure tracker transforms raw data into meaningful trends, helping you identify what works and what doesn't—all at a glance.
The Power of Visual Tracking
Most people track blood pressure simply by writing numbers in a table. While this is effective for recording data, it doesn't reveal the bigger picture. When you plot your readings on a graph, you can instantly see:
Gradual improvements or declines
Weekly fluctuations and patterns
The impact of medication changes
Correlations with lifestyle factors like stress or diet
How Our Visual Blood Pressure Tracker Works
This unique tracker combines traditional data entry with built-in charting capabilities. On a single page, you get:
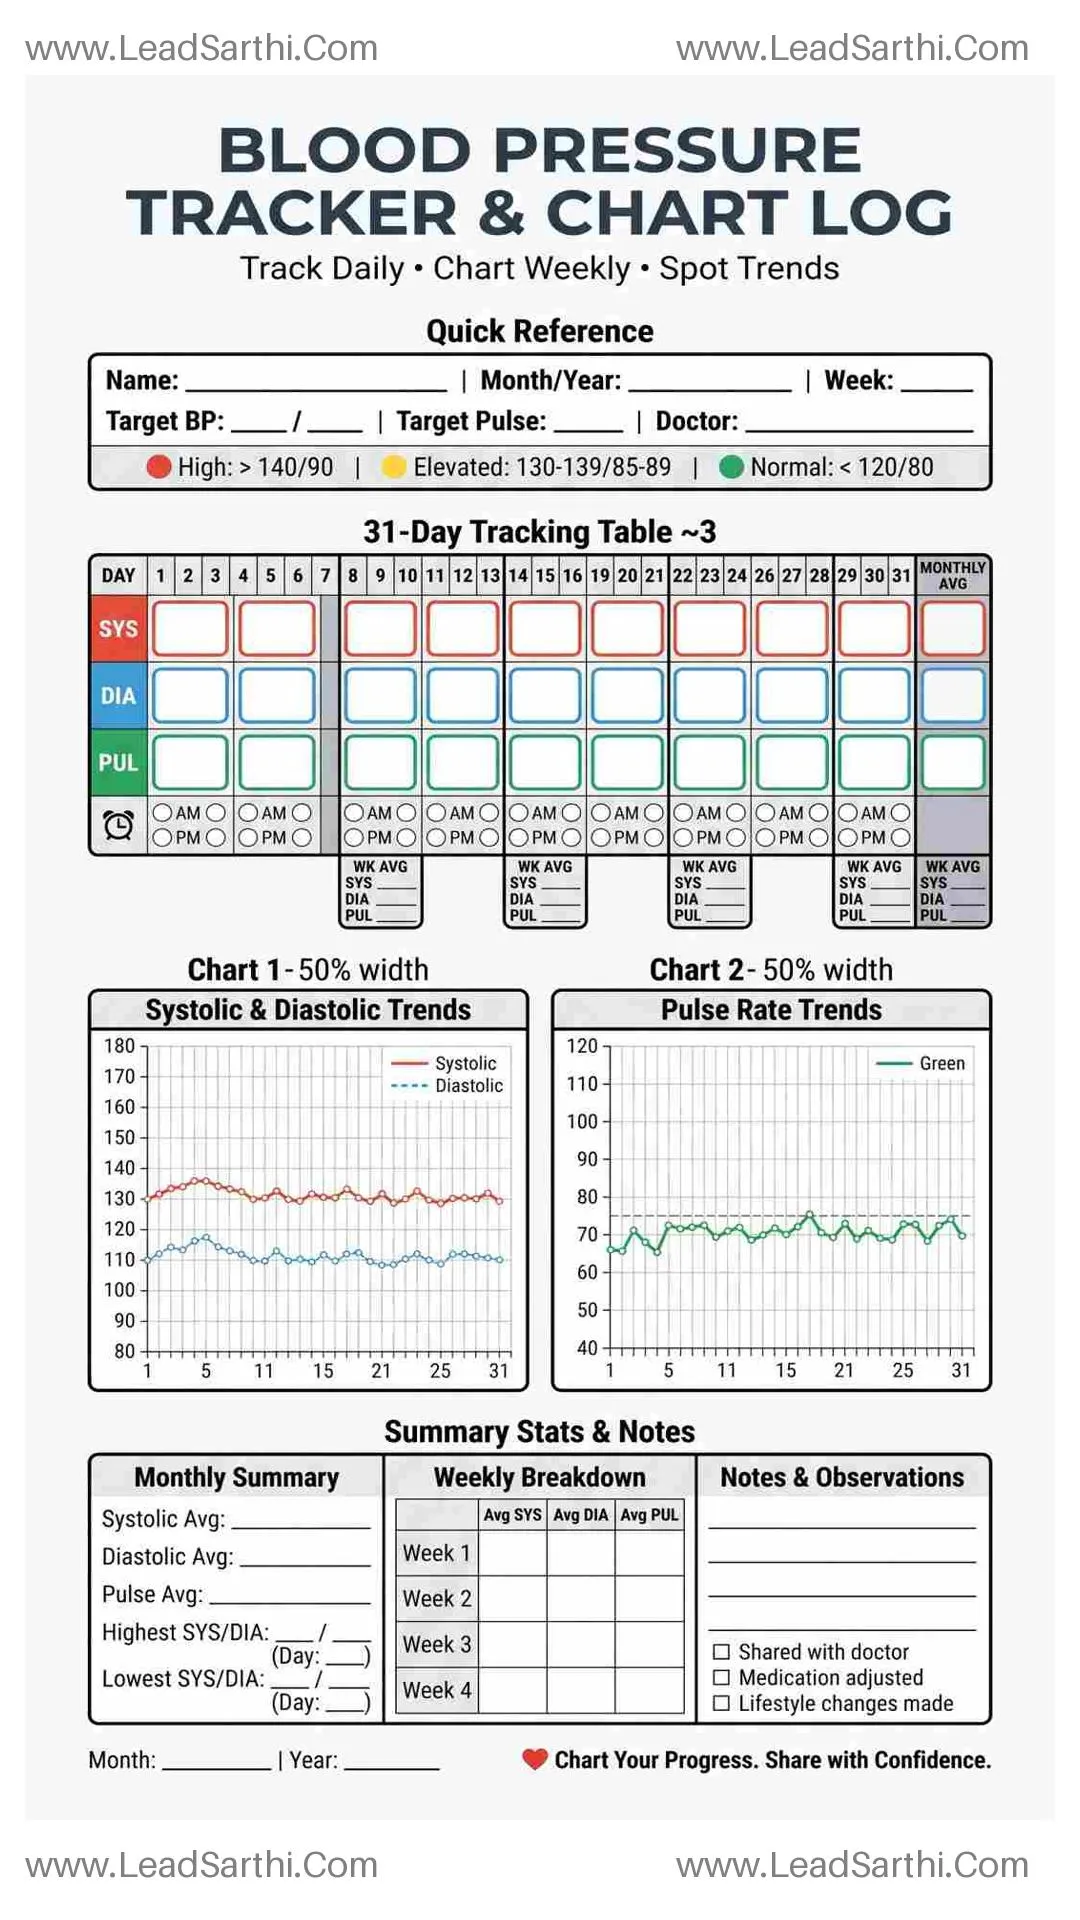
A 31-Day Tracking Table — Record your daily systolic, diastolic, and pulse readings in a compact format. Weekly average columns help you summarize data without extra calculations.
Two Visual Charts — The first chart allows you to plot systolic and diastolic trends simultaneously. The second chart focuses on pulse rate trends. Both charts are pre-labeled with X and Y axes, complete with numbered scales for accurate plotting.
Color-Coded Guidance — A quick reference box shows normal, elevated, and high ranges, helping you interpret your numbers immediately. Green indicates normal, yellow suggests elevated, and red signals high readings.
Monthly Summary Section — Calculate your averages, identify your highest and lowest readings, and document patterns for discussion with your healthcare provider.
Why Visual Data Matters for Blood Pressure Management
Pattern Recognition: Visualizing data helps you see weekly cycles, seasonal variations, and the impact of specific events or activities.
Medication Effectiveness: Charts clearly show whether your medication is working or if adjustments are needed.
Doctor Communication: A chart is worth a thousand numbers. Your healthcare provider can quickly assess your trends during appointments.
Motivation: Seeing improvement on a graph provides powerful encouragement to maintain healthy habits.
How to Use the Visual Tracker
Record your daily readings in the tracking table.
Plot your numbers on the corresponding charts using different colored pens for systolic, diastolic, and pulse.
Connect the dots to see your trend line.
Review your charts weekly to identify patterns and make informed lifestyle decisions.
Who Benefits from Visual Tracking?
This tracker appeals to data-oriented individuals, visual learners, healthcare professionals, and anyone who wants to move beyond simple number recording. It's especially valuable for patients working closely with doctors to fine-tune medication or lifestyle interventions.
Download our free printable Blood Pressure Tracker with Chart and start seeing your health story unfold visually.
This file is available in a3, a4, a5, us letter and us half letter size format. Pick one from the following that you need.
By downloading any file, you agree to use it for personal purposes only. Do not redistribute, resell, modify, or share this file in any digital format.
More Similar Templates You May Like
Template #1#
Template #2#

Template #3#
Comprehensive Blood Pressure Daily Log | Weekly Tracker with Lifestyle Factors | Printable Health Jo